
Case study · Product design & build · 2026
Seven days of
measuring, cut to half a day.
A Hong Kong ductwork subcontractor priced every tender by printing A1 drawings, laying them on a table and measuring them by hand with a scale rule. I designed and built DuctTake, a single-file desktop tool that does the same job on screen — and then spent four versions fixing the interface I got wrong.
1 The job
Pricing a tender means measuring every duct on the drawing
My father's company fabricates and installs ventilation ductwork in Hong Kong. To bid for a job they are sent a set of contract drawings — often 40-odd A1 sheets — and must return a price. Getting there means a takeoff: measure the length of every duct run, work out its sheet-metal area, count every fan, damper and fan-coil unit, then price the lot.
Nobody in the trade enjoys this part, and it sits directly on the critical path. Tender periods are short, and drawings get revised mid-bid.
01 Print
A stack of A1 sheets per tender, from the copy shop down the road. A revised drawing means printing it again.
02 Spread out
A table big enough to hold one sheet. One person can see one drawing at a time.
03 Scale and tick
Measure each run with a scale rule, tick off each fitting with a pen, write the figures on paper.
04 Re-key
Type those figures back into a computer to price them. This is where numbers get missed and mistyped.
The real pain
It is not only that five to seven days is slow. It is that a revised drawing sends you back to step one — and during those days two people cannot do anything else.
2 What I made
One HTML file. No server, no install, no account.
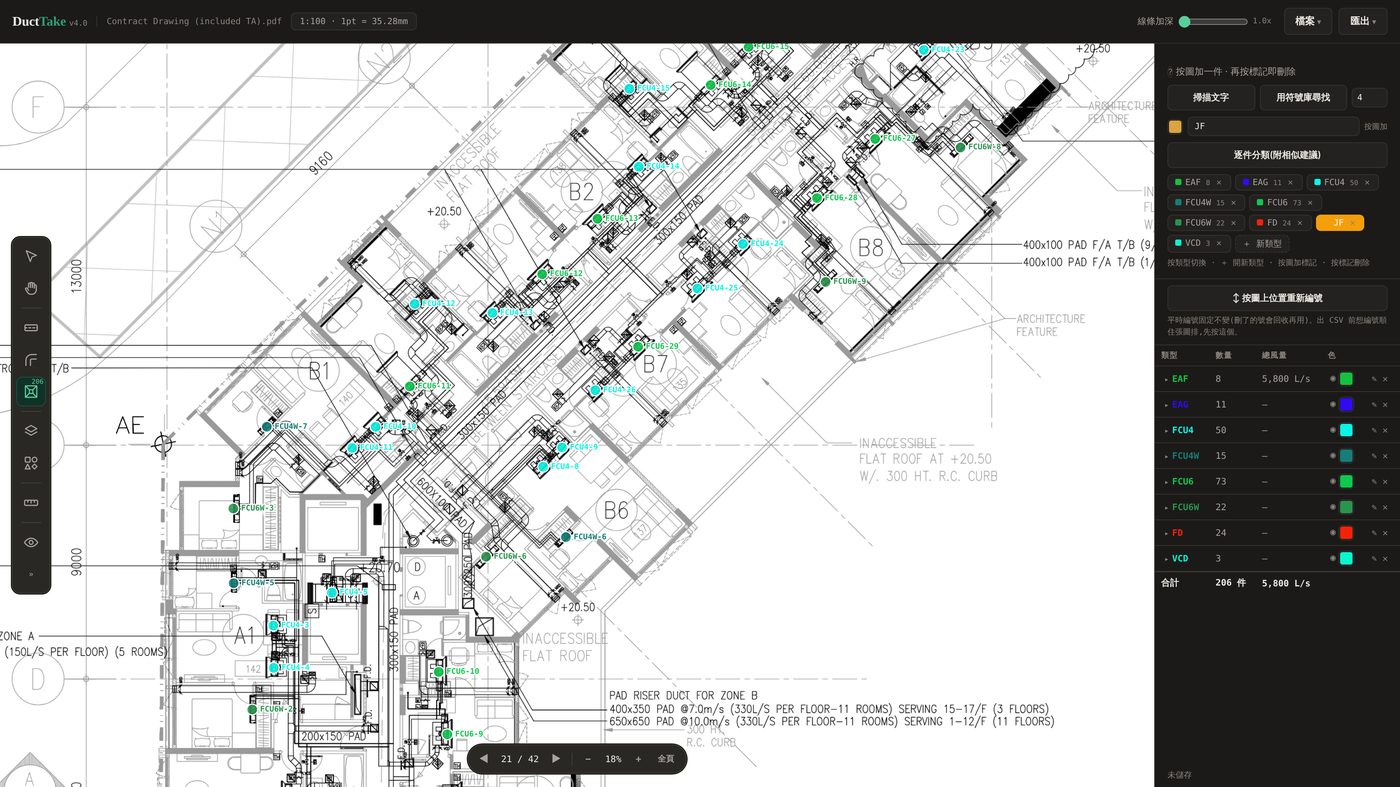
You drag the contract PDF in and start measuring. The pen snaps to the centreline of a duct, so tracing a run takes one click per bend instead of careful aim. Equipment gets a dot and a number. When you are done, it exports a priced spreadsheet and a marked-up drawing for the file.
The whole app is a single .html file a colleague can download and open. Nothing is uploaded; client drawings never leave the machine. For a contracting firm that is not a feature, it is the condition for being allowed to use it at all — no IT approval, no terms of service, no explaining where the drawings went.
Vector, not pixels
A CAD-exported PDF still holds every line as vector geometry. Most comparable tools rasterise the sheet and do image recognition; this reads the drawing instructions directly, so accuracy does not depend on zoom.
The pen finds the centre
A duct is two parallel lines. Click near it and the tool finds both walls and moves the pen to the middle. Whether the gap matches the size you locked is that click's confidence score.
The tool accumulates
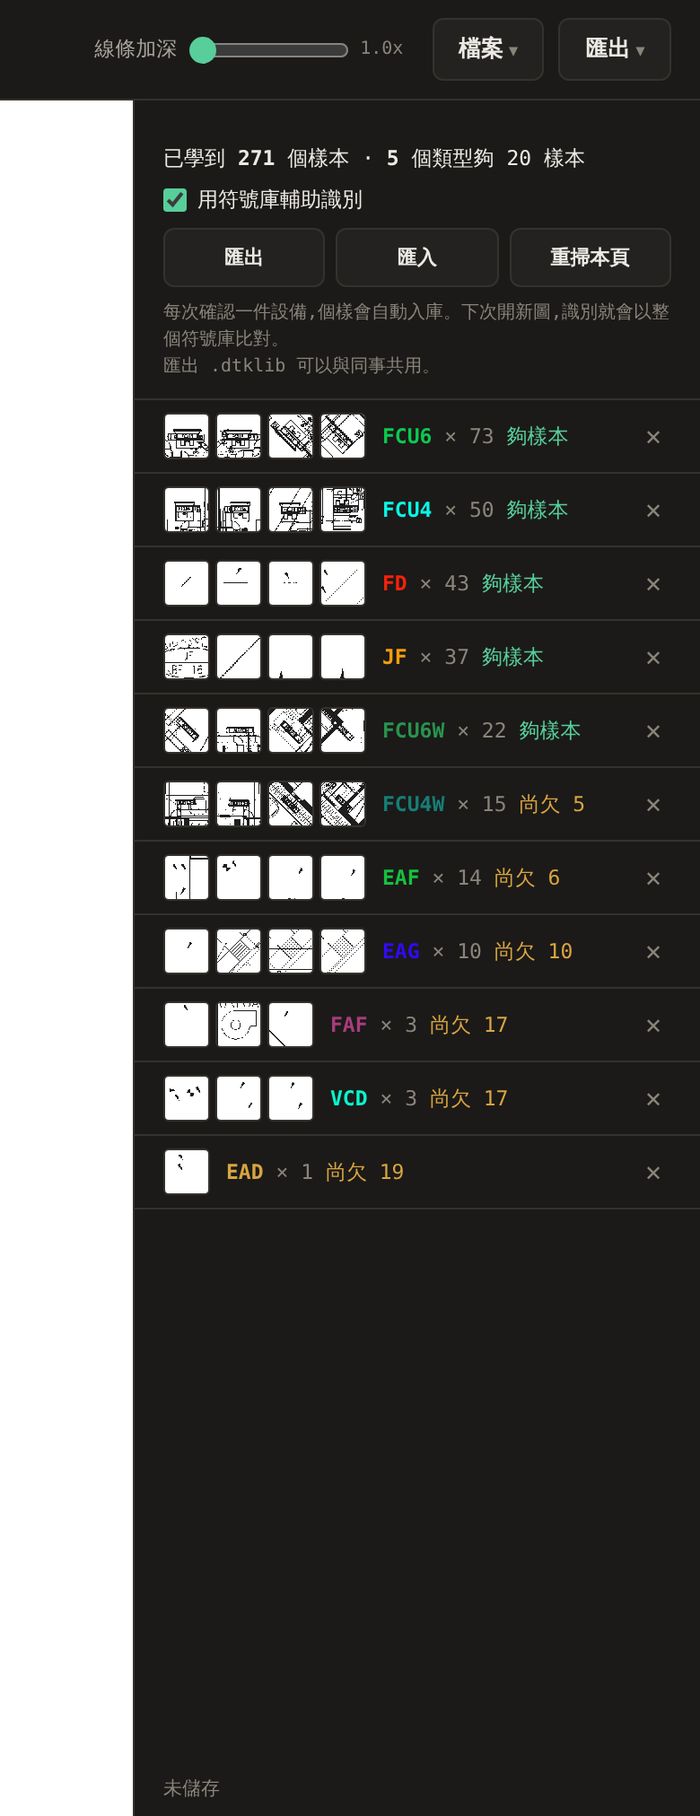
Every time you confirm a piece of equipment, it quietly files that crop as a training sample. Next drawing, recognition compares against everything you have ever confirmed.
3 How it got here
Four versions. Each one came from hitting a wall.
None of these were on a roadmap. I was the user, so the gap between hitting a problem and shipping the fix was usually the same day. Drawings carry a revision table recording what changed and why; this is that table.
| Rev | What it added | What it ran into |
|---|---|---|
| v1 | Duct measurement onlyCentreline snap, curved bends, live area calculation. | Ducts got fast — but equipment was still counted by eye, one at a time. Equipment was the slower half. |
| v2 | Automatic symbol detectionFind repeated vector shapes, count them in one pass. | Blind shape-matching swept up hatching, arrowheads and letterforms. One run returned 142 meaningless black lines. |
| v3 | Manual marking + a symbol libraryConfirm each item; every confirmation files a sample, which then filters detection. | Then a discovery: months of manual markup were already training data. I pulled 273 labelled items out of old tenders and shipped them as the starting library. |
| v4 | Interface rebuiltThree rows of controls collapsed into one rail; confidence turned from a readout into a router. | By the fourth round of features, I could no longer find my own controls. Adding features until the thing is unusable is a design failure, not a feature count. |
Why v1 shipped with almost nothing in it
The first version had no equipment marking, no detection, no library, no confidence scores, no zones or specs. Two modes, three tabs. But the single biggest block of time in a takeoff is measuring duct runs — so doing that one thing well was enough to earn its place on day one. More importantly, using it told me what to build next: equipment was still being counted by hand, so v2 had to be detection. That was not what I had planned to build.
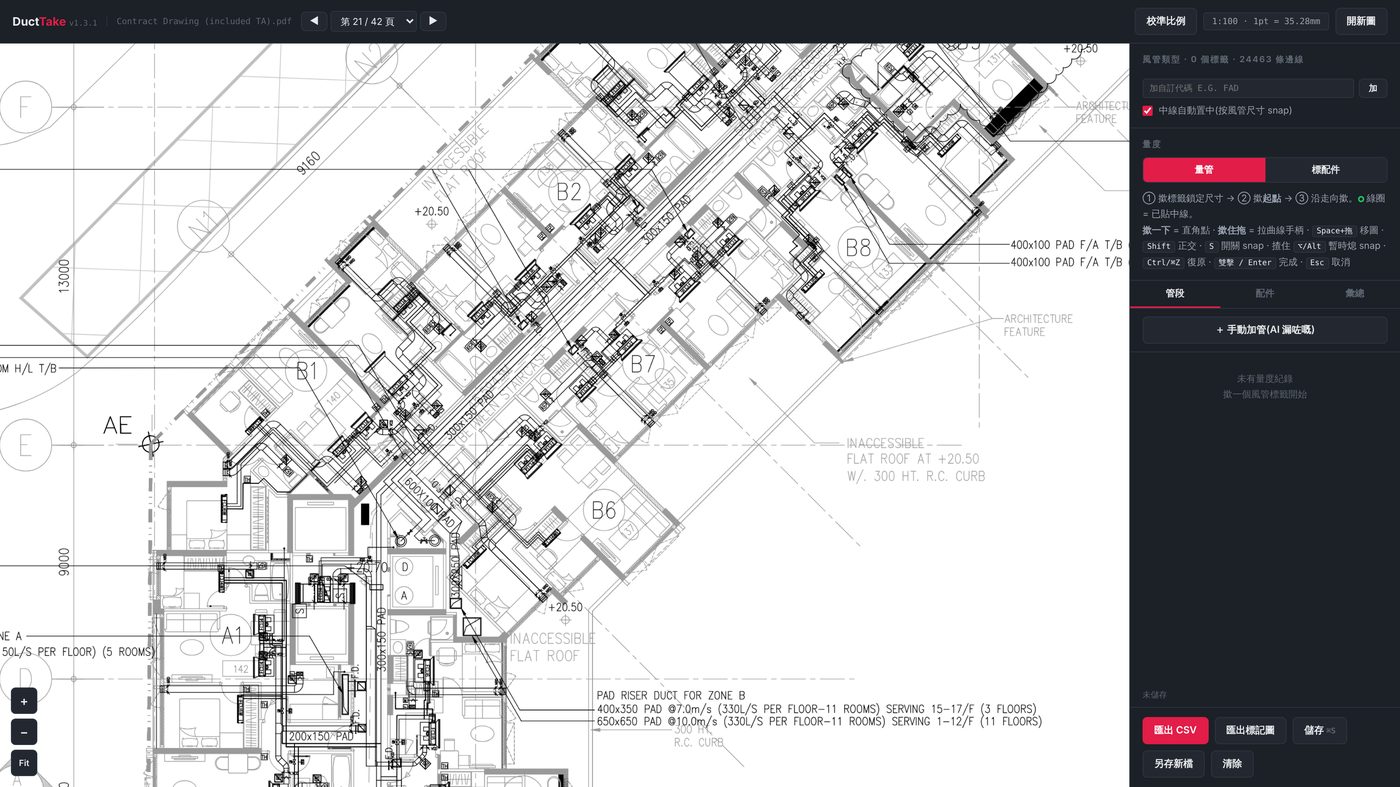
v1's manual-add button was originally labelled “add duct (the one AI missed)”. It was renamed: an interface should not blame its own shortcomings on the user's screen.
4 Design decisions
I ran no usability tests. I was the one using it every day.
That is not a substitute for research, and on a product with real users I would not rely on it. But it did produce something a test rarely gets: the problems surfaced mid-task, with half a drawing measured and a deadline running. All three turned out to be conceptual errors rather than visual ones.
“Even I'm starting to not know how to use this.”
- Diagnosis
- The same four nouns — duct, fitting, equipment, label — appeared in three separate places: layer toggles top-left, tool buttons mid-panel, list tabs below. Three vocabularies for one idea.
- Change
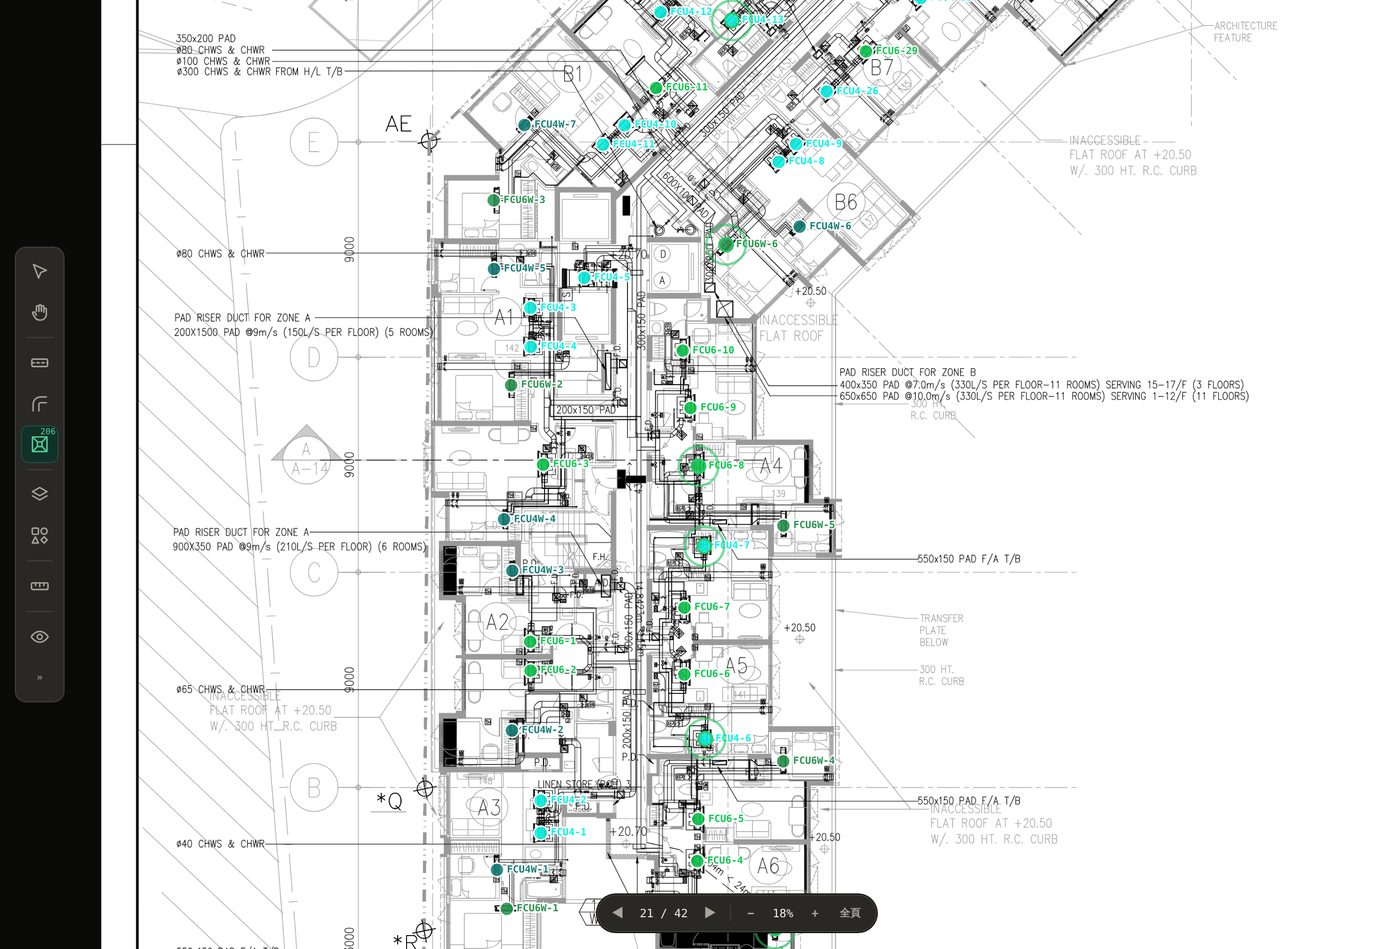
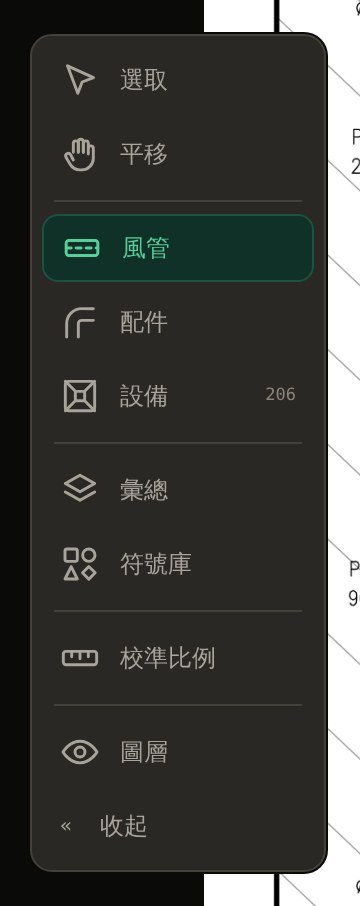
- Three rows collapsed into one. One control = tool + list + visibility toggle. In v4 that control moved to a floating rail on the left, where tools belong.
Ducts I had just measured disappeared.
- Diagnosis
- “Show only items needing review” stayed on once switched on. Everything measured afterwards was filtered out of the list immediately, with no indication why.
- Change
- Adding anything new clears the filter automatically — and says so. A filter that hides the user's own work in progress is not a filter.
It told me to check something, but not where.
- Diagnosis
- The side panel reported “2 items low confidence”. The drawing showed nothing. Clicking a symbol row only moved the viewport — you were staring at a plan with no idea what it meant.
- Change
- A rule: whenever the panel says something is there, the drawing points at it. Turn to the page, zoom to fit, pulse a green ring on every location, select the row.
A category that was quietly wrong.
- Diagnosis
- Four of the “fittings” had an equivalent length of zero — they added no duct area at all, they were only counted. Which means they were never fittings. They were equipment.
- Change
- Moved, with migration for existing files. Afterwards the rule fits in one sentence: fittings add area, equipment gets counted.
How the rebuild was verified
57 automated tests, including loading the real 31 MB contract drawing and replaying 160 marks to check their coordinates survived. The run caught three bugs I had written myself — among them a state latch that left the drawing unresponsive after switching tools, which I would not have found by clicking around.
5 The wall
More training data made it worse
Recognition hit 84% on the first drawing set. I added a second project — 273 samples in total — and accuracy fell to 70%. That is the opposite of how this is supposed to work, so I went looking.
Of 83 errors, 46 were the same confusion: FCU4 read as FCU6. On the drawing those two are the identical symbol. The only thing separating them is the four letters printed inside the box. And in this PDF the text is outlined curves, not text: across 205 marker positions, text extraction returned zero characters.
So shape comparison has a ceiling here, and no amount of tuning moves it. I measured that rather than assuming it.
| Approach | Result | Read |
|---|---|---|
| Raster template match, radius sweep 6–50 pt | 70% | Best single configuration |
| Multi-scale composite + k-nearest voting | 69% | No help |
| Vector isolation, redrawn on a clean canvas | 58% | Worse |
| Descriptor resolution raised 72 → 256 px | no change | Resolution was never the bottleneck |
| Tesseract OCR over 600 DPI crops | 0% | Cannot read outlined letterforms |
| Crops tiled for a vision model, 320 px tiles | 94% | Reading the label works — if the tile is big enough |
Two bugs found on the way
Normalising every crop to the same size threw away physical dimensions — and physical size is one of the things that tells these symbols apart. Switching to a fixed window took accuracy from 62% to 70%. Separately, the best crop radius turns out to be per-type, not one global number.
Where the limit actually was
At 160 px tiles a vision model read the labels at 75%; at 320 px, 94%. The difference was not the model, it was whether the letters survived the tile. A whole A0 sheet in one request reads nothing at all.
6 The call
Local finds it. The cloud reads the label. Confidence decides which.
The architecture follows the measurement rather than the fashion. Shape matching runs on the machine: free, instant, and the drawing stays put. It is good at saying where equipment is and which family it belongs to — JF 86%, FD 77%, FCU6 81%. It is bad at the one step that needs reading.
So confidence became a router instead of a readout. High scores fill in automatically. The uncertain middle is the only thing sent out to be read. Anything still low lands in a human review list — with a green ring on the drawing showing exactly where.
The judgement, stated plainly
Cost was never the constraint — $79 a year is less than half a day of a tradesman's time. Don't avoid a model because it sounds expensive, and don't hand it everything because it is available. Use it at the one step where it genuinely beats what runs locally. With 273 labelled items already carrying correct answers, which model to use is now something I can test rather than argue about.
7 Where it stands
In use on two live projects
Not a prototype. The takeoff for Ap Lei Chau CK and AsiaWorld-Expo was priced with this tool, by one person, on a desktop, with nothing printed.
Timings from the company's own records. Automatic marking covers about 80% on drawings with readable text and about 50% on outline-only sheets; the rest is marked by hand, with the tool snapping and counting.
8 The other half: Lin Sing Asia
Thirty years of work, nowhere to see it
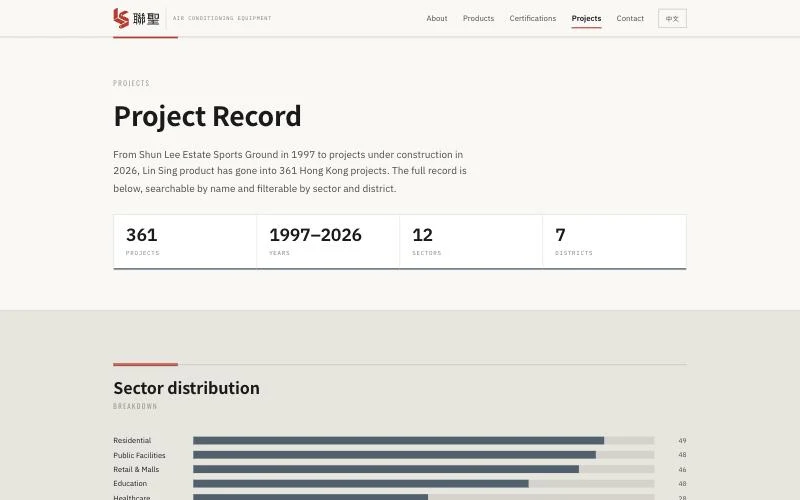
DuctTake changed how the group quotes. The other problem was how it gets found. Lin Sing, the group's ductwork and flange maker, has run its own factory in Huizhou since 1997, and its products are in hundreds of hospitals, stations and housing estates. The website showed none of that.
Enquiries went to four personal mailboxes spread across Hotmail, Yahoo and QQ. The project history was a 370-row spreadsheet nobody outside the office could read. And the brand red was doing seven different jobs on a cool grey background, so every highlight looked like an error message.
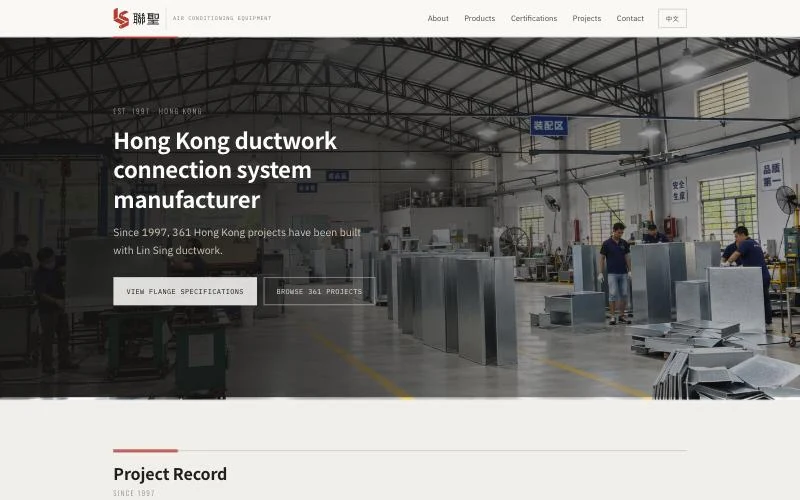
The red wasn't the problem. The grey under it was.
Warm red on cool grey is how every operating system draws an error state. I kept Lin Sing's exact red, #CC3333, and changed only the ground, to a warm drawing-paper tone. Now it reads as a seal, not a warning. Red went from seven jobs to two: the logo, and a short bar above each section heading. Technical content such as spec tables, QC steps and data moved to a steel blue. The identity draws on the factory's two core processes, folding and rolling.
I cleaned 370 rows of project history into 361 projects. Updating the list now means exporting a spreadsheet; changes go live in a minute or two. Visit linsingasia.com
9 What transfers
Traditional industries don't resist software. They resist learning a new process.
-
Start from the existing motion
Every action in the tool is something the estimator already did on paper: run your finger along a duct, tick off each piece. Nobody had to learn a new concept to get value on day one.
-
Make the barrier to entry near zero
One HTML file, processed locally, no account. No IT approval, no terms of service, no conversation about where the client's drawings went.
-
Automation has to admit what it doesn't know
Confidence scoring lets the tool name the items it is unsure about. A tool that admits its misses is the only kind a tradesman will trust on the ones it got right.
-
Measure before you redesign
Three architectures, five accuracy numbers, one dead end proven dead. Knowing when to stop tuning and change direction saved more time than any of the tuning did.